
Cost functions in machine learning measure the performance of the machine learning algorithm trained on a particular dataset. By measuring the cost function or cost for a specific model, we can easily measure the error of the machine-learning model trained. There are many types of cost functions, from which depending on the problem statement the single or multiple cost function can be chosen to measure the model’s performance.
In some references, the cost function is also the loss function. However, there is a slight difference between them. The loss function measures the model’s performance on a particular dataset for a single data record. In contrast, the cost function is a measurement of full-length data. Many types of cost functions are used in different machine learning. However, various cost functions are used for classification and regression problems.
Table of Content
- Confusion Matrix
- Accuracy Score
- Precision Score
- Recall Score
- F-Beta Score
- Sensitivity
- Specificity
- Positive Predicted values
- Negative Predicted Values
- ROC-AUC Curve
1. Confusion Matrix
A confusion matrix is an instrumental measurement to observe the way the model performs wrong or right. It is a matrix that compares several predictions for each class correctly and incorrectly classified by the model.
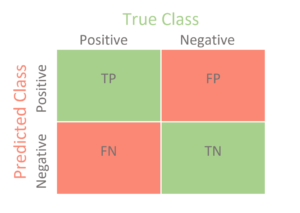
In the confusion matrix, there are mainly 4 measurements of terms related to the model’s error, using which we can measure the model’s performance in different ways.
I. True Positive (TP): The number of positive observations the model correctly classified as positive.
II. False Positive (FP): The number of negative observations the model predicted as positive values. It is also known as a Type 1 error.
III. True Negative (TN): It is the number of negative observations which the model predicted as unfavorable.
IV. False Negative (FN): The number of positive observations the model incorrectly classified as negative values. It is also known as a Type 2 error.
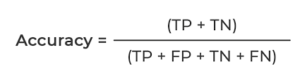
2. Accuracy Score
The accuracy score is the ratio of correctly classified predictions and the total predictions done by the model trained.
It is the most widely used cost function used in classification problems.
In some cases, the accuracy score is not an idea cost function for measuring the model’s performance. e.g., e.g.le working on any healthcare project, if the accuracy is 99%, it will still not be considered the best performing model, and there should not be any risk related to human life.
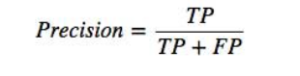
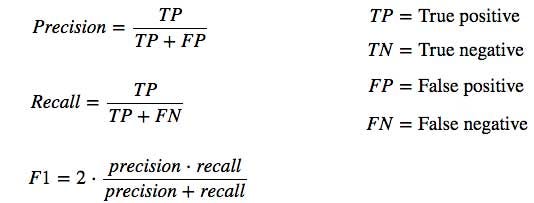
3. Precision Score
Precision Score is the ratio of a correctly classified pass or fails prediction with the sum of a pass or failure prediction.
The main aim of a precision score is to reduce the wrong prediction, i.e., false positive and false negative.
Precision in classification problems is referred to as quality. Higher accuracy means the model returns quality results, and most of the results from the model are good in quality and uthentic.
Example: If the model predicts the express mail as spam, but it is not spam, then it is considered a false negative.
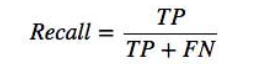
4. Recall Score
Recall Score is the correctly predicted pass or fail value ratio by its total receipt or fail predictions.
Recall score in classification is referred to as the quantity, which states that higher recalls mean the model return most of the relevant results. Whether it is appropriate or irrelevant, results are also returned.
5. F-Beta Score
The F-Beta score is the harmonic mean of the precision and recall score. Where the B (beta) parameters define the recall weight in the combined score.
If B 1: More weight to recall.
B = 0: Only precision.
B = Infinity: Only Recall.

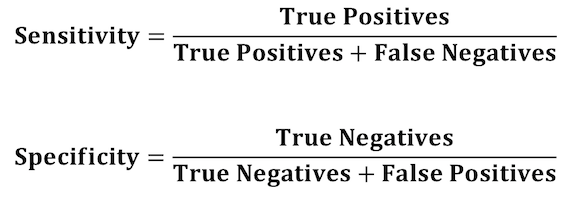
6. Sensitivity
Sensitivity is a metric that is used to evaluate the ability f the model to predict the true positive of all available categories.
It is the ratio of predicted positive values by the sum of predicted positive values and falsely predicted negative values.
A Higher sensitivity test means that there are few false negative results.

7. Specificity
Specificity is the performance of a model to predict the true negatives correctly.
A higher specificity test means that there are few false positive results.
It is the ratio of indeed predicted negative values and the sum of actual expected negative values and falsely precited positive values.

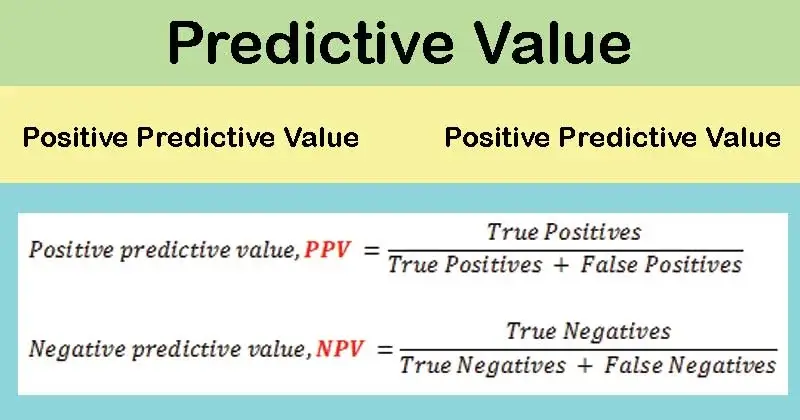
8. Positive Predicted Values (PPV)
Positive predicted values are the proportion of positive predicted values which are true positives.
It is the ratio of true positives by the true and false positive predicted values in the model.

9. Negative Predicted Values (NPV)
Negative predicted values are the proportion of negative predicted values which are true negatives.
It is the ratio of true negatives by the true and false negative predicted values in the model.

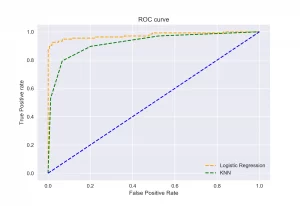
10. ROC-AUC Curve
In classification problems, it is necessary to rely on multiple metrics to confirm whether a model is performing better. The receiver operating characteristics or ROC curve is a plot of True Positive rates vs. True negative rates. It is also called that it is a plot between sensitivity and (1-specificity).
The area Under the Curve or AUC can be referred to as the ROC curve’s summary, with values between 0 and 1. The value 1 of AUC means that the classifier performs very well and makes no mistakes. In contrast, while the value 0 for AUC, the prediction phase implies that the classifier predicts the values very severely, for example, positive as negatives and negatives as positives.
The ROC-AUC Curve can be plotted for the different machine-learning algorithms to compare the results from the prediction phase.
Conclusion
In this article, we discussed the nine most widely used cost functions in classification problems and the maths working behind them. Knowledge about these classification cost functions will help one to understand and evaluate the classification model in different ways for better model building.
Some Key Takeaways from this article are:
- Cost functions measure the model’s performance on the total volume of the dataset. In contrast, loss functions are the error record on a detailed dataset description.
- By measuring different cost functions for the same model, we can get an easy idea about other errors in the model.
- Precision is the measure of quality, whereas Recall is the measure of quantity.
- Accuracy, Precision, recall, and F-Beta Score are the most common cost functions used while working with classification problems. In contrast, Sensitivity, Specificity, PPV, and NPV are the specific cost functions used if a particular problem can be solved using them.